Force data information
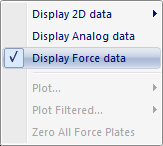
Click Display Force data in the Data info window menu, to show the force data for all force plates in the Data info window.
To show the force data the calibration settings of the force plate must have been set on the Force plate page in the Project options dialog and the Calculate force data option must have been used during processing or Recalculate forces applied on the capture file, see chapter Calculating force data.
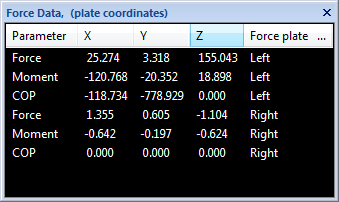
The Data info window will then contain data for the force plate's Force, Moment and COP (Center Of Pressure) vectors. The data is for the actual force on the force-plate. The displayed data is for the current frame in the following five columns:
-
Parameter
The name of the vector. -
X, Y, Z
The size (in N, Nm respectively mm) of the vector in the internal coordinate system of the force plate, if you are using the Local (Force plate) setting. The Z direction of the force plate coordinate system is pointing down. -
Force plate
The name of the force plate for the data in that row. -
The coordinate system that is used is displayed in the title of the window, plate or lab. You can switch between the coordinate system on the Force data page in Project options dialog, see chapter General settings.
-
The Force and the COP is also visualized with a vector in the 3D view window. The vector is the opposite force applied to the force plate, i.e. opposite to that shown in the Data info window.

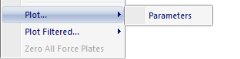
To plot a vector select one parameter, click Plot on the Data info window menu and then click Parameter. The data of the X, Y and Z directions are plotted for the selected parameter in one window. It is not possible to plot more than one parameter in one window. For information about the Plot window see chapter Plot window.
The number of seconds in the force plot is specified on the GUI page in the Project options dialog, see chapter GUI.