Force data calculation
Calculating force data
The force data is calculated from the analog signals
of the force plate. It uses the parameters of the force plate on the Force
plate page in the Project options dialog to calculate the correct values, see chapter Force plate settings. Force data can be calculated as a processing step or manually
with the Recalculate forces icon  .
.
The reset signal is sent at the following operations in QTM:
-
New file
-
Changing a setting in Project option in QTM during preview
-
Just before the Start capture dialog is opened before a capture
-
In a batch capture just before QTM starts Waiting for next measurement/trigger
It is important to not stand on the force plate at the start of the measurement, if you use the Remove offset/drift option on the analog data. It is also important to not stand on a force plate when the reset signal is sent.
When the Recalculate forces command is used the settings of the force plate can be changed in the File reprocessing dialog. The settings in the dialog are the same as when the file was created. However, if the settings were not specified for the motion capture the current settings in the Project options dialog are copied instead.
Viewing force data
The force data in a capture file can be viewed in the Data info window and as a vector in the 3D view window. The data can be used to confirm that the analog capture works and that the settings for the force plate are correct. For information about the data in the Data info window and how to plot it see chapter Force data information.
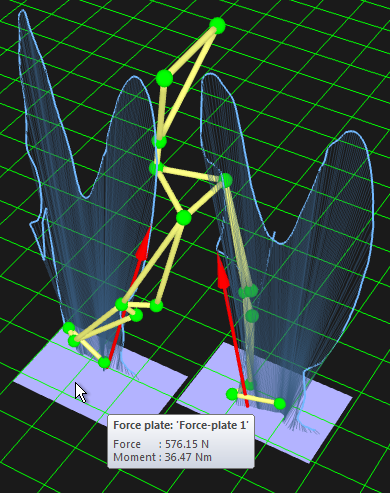
In the 3D view window the force data is displayed as a vector with its base in the Center Of Pressure (COP). The vector displays the opposite force applied to the force plate, that is the reaction force. The purple squares represent the force plates and are placed at the force plate coordinates that are specified on the Force plate page in the Project options dialog. The light blue force traces (Pedotti diagrams) display the force data for the selected measurement range. Place the mouse over a force plate or force arrow to view a tool tip with the force data in the current frame.
The display of force arrows, plates and traces can be toggled on the 3D view settings page in the Project options dialog. The color and size of the force can also be changed on this page.
The force plates that are activated on the Force data page will be shown in the 3D view window even if there is no analog data. So you can show a force-plate even if there is no analog data. Which can be used if the force is collected by another program, but you want to see the force plate location in QTM.
If you transform the global coordinate system the force plate coordinates will be the same, which means that you have to change them to move the force plate to the correct location, see chapter Force plate location.
The Z direction of the force plate coordinate system is pointing down.
To make the most of the force data it can be exported to an analysis software. The best format to use are TSV, C3D or MAT file, because then the force plate location and for TSV and MAT the force data is included in the file, see chapter Data export to other applications. For example Visual3D uses C3D and recalculates the forces from the original data, therefore it can differ some from what is displayed in QTM.