Plot window
The Plot window is used for displaying graphs of various types of data via the Plot or Analyze Trajectory commands.
The Plot window can be docked into QTM or it can be used as a floating window, and the Window arrangements can be saved as Window layouts. For detailed information, see chapter Window handling.
The Plot window contains the following elements:
-
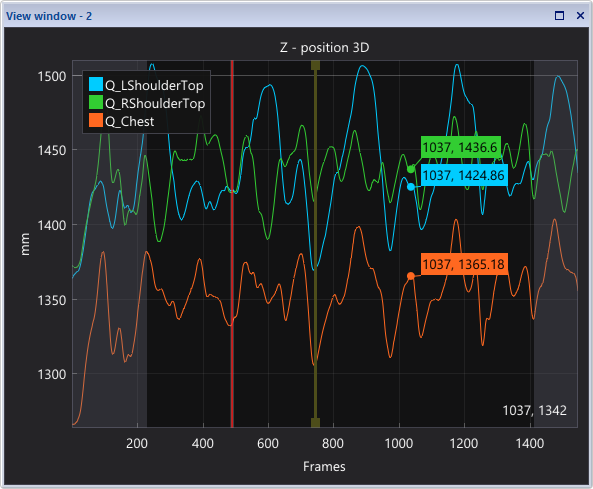
The title showing what is plotted in the graph.
-
The axes showing the X and Y values of the data and their units. The X units can be Frame or Time, dependent on the type of data displayed.
-
The plot area showing:
-
Data series
Line plot of plotted data. The colors of the lines correspond to the trajectory colors. For other types of data, the color cycles through a preset color map. -
Events
Vertical lines representing events on the time line. The colors correspond to the event colors. -
Legend
The legend shows the names and colors of the plotted data series. The legend box allows for the following interactions:-
Hover with the mouse over a label to highlight it in the graph.
-
Click on a label to show or hide the data series.
-
-
-
Time cursor
The time cursor shows the position of the current frame. Interactions:-
Click and drag to move the time cursor.
-
-
Tool tip
When moving the mouse in the plot area a tool tip shows the Y values of the displayed data series at the current X position of the mouse. The color of the tool tip corresponds to that of the data series. -
Mouse position
When mowing the mouse in the plot area, the X and Y values of the mouse pointer position is shown in the lower-right corner. -
Plot range
Areas outside the measurement range are grayed out. If the range filter in the plot menu is disabled, data outside of the selected measurement range is shown in the gray area. The plot range allows for the following interactions:-
Click and drag the plot range edges to modify the measurement range.
-
For detailed information about plot features and interactions, refer to the following chapters.