Skeleton data information
The data of the skeletons in the current frame can be viewed in the Data info window. The skeletons will be shown in the same order as on the Skeleton solver page and the data will use the definitions for angles and local coordinate system on the Euler angles page.
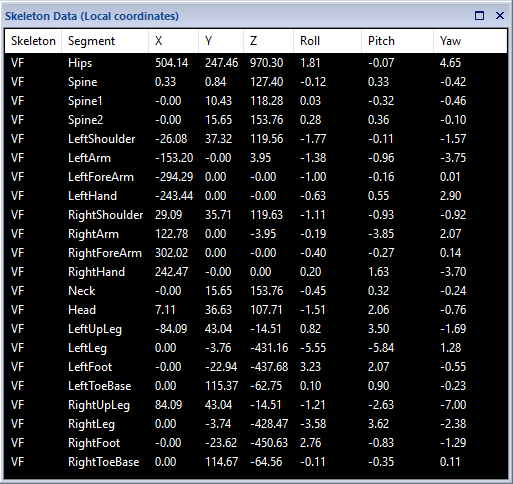
Click Display Skeleton data in the Data info window menu to show the skeleton data in the following eight columns:
-
Skeleton
Name of the skeleton. -
Segment
Name of the skeleton segment. -
X, Y, Z
Segment 3D positions. -
Roll, Pitch, Yaw
Segment orientation expressed in Euler angles. For custom Euler angle definitions the order and names of these columns are as defined by the user.
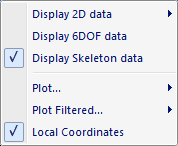
The following menu options are available when right clicking in the Skeleton data information window.
-

Local Coordinates
Display local coordinates of segments relative to their respective parent segment when checked. Display global coordinates of segments when unchecked.Local coordinates with the Qualisys Sports Marker set gives you the joint angles in Roll, Pitch and Yaw.
To plot skeleton segment data, select one or more segments, click Plot or Plot filtered in the Data info window menu and select the type of data to plot. With Plot filtered you can apply a Fit to 2nd degree curve or Moving average filter.
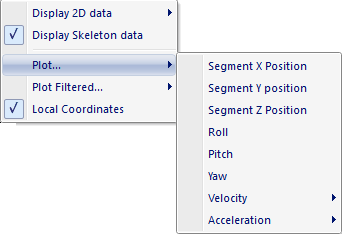
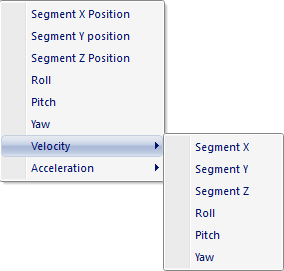
You can also plot the velocity and acceleration in the three directions of the coordinate system for segment data and the angular velocity and acceleration for the three rotation angles. It is recommended to use Plot filtered and apply the filter before the calculation for Velocity and Acceleration, because the noise is amplified by the calculations.
For information about the Plot window, see chapter Plot window.