3D Tracking
![]()
The Tracking page contains settings for the 3D tracking of the motion capture data. The 3D tracker uses 2D data of the cameras in the system to calculate a trajectories in a 3D view, see chapter 3D tracking measurements.
3D Tracker parameters
![]()
The 3D tracking function uses a small buffer (4 - 10 frames) of previous positions of a trajectory to predict the next location of the trajectory’s marker in 3D space. The function uses a very general algorithm with just a few tracking parameters that adjust the equations to specific tracking problems. The contribution of individual cameras to the estimated 3D position of a marker are weighted so that rays closer to the center of the sensor are weighted higher than rays closer to the edges.
The behavior of the 3D tracker can be controlled by the following parameter.
Prediction error
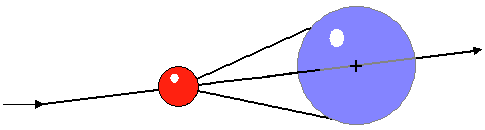
The Prediction error parameter specifies the maximum distance (in mm) between a predicted position of a trajectory and a captured point that is allowed for it to be assigned to that trajectory. The parameter therefore provides a margin of error with which a 3D point may deviate from the mathematically calculated next position. Since real-world data cannot be expected to exactly fit an equation, this provides a mechanism for dealing with the unpredictability of the real changes in a marker’s trajectory. The example above shows the 3D point (the red ball) and its predicted next position (the black cross). The blue sphere is the volume in which the next 3D point is accepted as part of this trajectory.
The default value of the Prediction error is 25 mm. If the Prediction error is larger than half of the closest distance between two markers in the measurement, there is a possibility of trajectory cross-over or swapping between the two trajectories. Therefore, if erratic or jumpy motions within single trajectories are seen, then it is likely that the parameter has been set too high. On the other side if the value is set too small, excessive division of trajectories (high segmentation) will occur, resulting in many more trajectories than markers. The reason is that the distances because of noise and acceleration might be greater than that allowed for by the Prediction error parameter. Therefore, if high segmentation or gaps in the data are experienced it is likely that the parameter is set too low.
Maximum residual
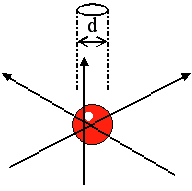
The 3D tracking function uses the Maximum residual parameter together with the Prediction error to control the continuation of already started trajectories. The Maximum residual sets a limit (in mm) to the distance from the final location of the 3D point within which all intersecting camera rays are considered to belong to that 3D point. The example above shows three camera rays where the intersections are not in the same point, but they are all within the Maximum residual (d) of the 3D point (the red ball). The parameter is shown as a circle but in reality it is of course a sphere around the 3D point.
The default value of the Maximum residual is 6 mm. The value for the parameter can usually be set to 2 - 5 times the average residual values in the calibration result for the camera system. A too large value will slow down the calculation and will tend to produce merged 3D points, resulting in defective trajectories. On the other hand a too small value will probably cause ghost markers and high segmentation, resulting in many more trajectories than markers.
Minimum trajectory length
The Minimum trajectory length parameter defines the minimum number of frames for a trajectory. The default value is 2 frames, which is also the minimum value since a trajectory that is only 1 frame long is not really reliable.
Increase the number of frames if you have a lot of short extra trajectories. When those are removed the AIM process will also work better. However it is a good idea to check so the extra trajectories are not caused by something else, e.g. a bad calibration or something reflective.
Minimum ray count per marker
The Minimum ray count per marker parameter defines the minimum number of cameras required for the 3D tracking of a marker. The default value is 2, which imposes no limitation to the 3D tracking.
Increasing this value adds constraints to the 3D tracker by requiring that at least the set number of cameras must be involved in the reconstruction of a 3D marker. This can be useful in situations in which tracking artifacts in the form of ghost markers occur. It is recommended to keep this value as low as possible since higher values may result in additional trajectory gaps and a decrease of the effective capture volume.
Ray length limits
The ray length limits represent the minimum and maximum distance between a marker and a camera to be used for 3D tracking. The units are in meters.
When the option Automatically calculate ray length limits is checked, the ray length limits are automatically calculated based on the current calibration. When this option is unchecked, you can manually set the minimum and maximum ray lengths.
For fixed calibrations the automatic minimum ray length is always set to 0.5 m.
Rays
![]()
Camera tracking rays are a mapping between 2D data of the cameras and the 3D trajectories, which can be shown in the 3D view window, see chapter Rays in 3D views.
To show the rays, they must be stored during the 3D tracking stage of the processing. To store the rays, make sure that the option Store is enabled.
When the Store option is enabled, the processing will take longer time and the file size of the QTM file will be larger.
Auto join
As soon as a marker is completely hidden during the measurement, even if it is just for one frame, a new trajectory will be started by the tracking function. The Auto join function examines the trajectories after the tracking to see if any can automatically be joined. The Max frame gap specifies the number of frames allowed between two trajectories that will be qualified for joining, the matching number of milliseconds with the current frequency is displayed next to the option. The Auto join function then uses the tracking parameters to decide if two trajectories can be joined.
The Auto join function is enabled by default with a value of 10 frames, and it can be used to make the identification easier.
Auto join only joins two trajectories so that they are one in the trajectory info windows. If you want to fill the gap between the two trajectories with data you need to use the gap-fill function, see chapter Trajectories.
Bounding box restricting 3D data
The bounding box is the volume in which the trajectories will be calculated. The use of a bounding box can be helpful to reduce the amount of unneeded data by discarding 3D data which falls outside the volume of interest. The bounding box is displayed as a white outlined box in the 3D view, the display is controlled on the 3D view settings page.
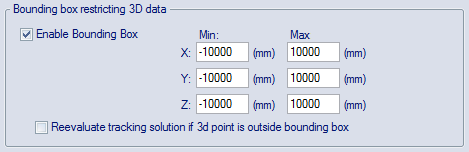
When enabling the bounding box, the 3D data is restricted to the volume spanned up by the bounding box. The limits of the bounding box can be defined in the text edit fields as distances (in mm) in each direction to the origin of the global coordinate system. The default behavior is that 3D points that fall outside the bounding box are discarded, i.e. the option Reevaluate tracking solution if 3D point is outside bounding box is unchecked. By checking the option Reevaluate tracking solution if 3D point is outside bounding box the 3D tracker will try to find alternative solutions for 3D points if the initial solution lies outside the bounding box. This can be useful for small systems, for example with two cameras.
If you use a bounding box and then translate or rotate the global coordinate system the bounding box will also be moved. This may result in that you move the bounding box outside the wanted measurement volume. Therefore the bounding box must be corrected manually after the transformation.
Auto range
The Auto range option automatically sets the measurement range so that it only includes frames that have 3D data. The empty frames are not deleted just placed outside the measurement range. Increase the measurement range on the Timeline control bar if you want to use more frames, see chapter Timeline control bar.