Plot menu
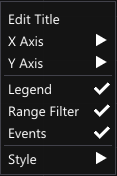
The Plot menu contains the settings and layout options of the plot. It can be accessed by right-clicking anywhere in the Plot window.
The following options are available:
-
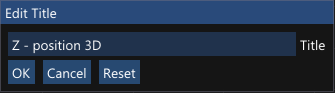
Edit Title
Open a dialog for modifying the plot title.
-
Use the Reset button to revert to the initial title of the plot.
-
-
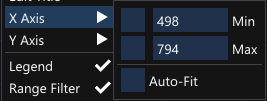
X Axis / Y Axis
View or modify the respective axis settings.
-
Edit Max or Min to set custom plot limits.
-
Select the check boxes for Max or Min to use fixed values for the plot limits.
-
Select Auto-Fit for automatically adapting to the data range.
-
-
Legend
Show or hide the legend.
-
Range Filter
Enable or disable the range filter.
-
When Range Filter is enabled, only data within the selected measurement range is shown.
-
When disabled, all data within the measurement range is shown, and data outside of the selected range is shown in the gray area.
-
-
Events
Show or hide events.
-
Keep History
Enable the preservation of current data when reprocessing.
-
When Keep History is enabled, current plot data is preserved for easy comparison of data before and after reprocessing.
-
When reprocessed data is added, a time stamp is appended to the legend text to easily distinguish between the original and the reprocessed data.
-
When the option Random Colors is enabled, another color will be used for the reprocessed data series for easier comparison.
-
-
When Keep History is disabled, the plot data is updated after reprocessing.
The default behavior of the Keep History and Random Colors options is set by the Plot settings on the GUI project settings page.
-
-
Random Colors
Enable to use random colors for data series when adding reprocessed data, when Keep History is enabled.
-
Style
Choose between dark or light mode.
When using Window layouts, Plot menu settings are stored as part of the Windows layout.