Identifying spikes
The trajectory editor provides an easy way to identify spikes in your data for smoothing.
-
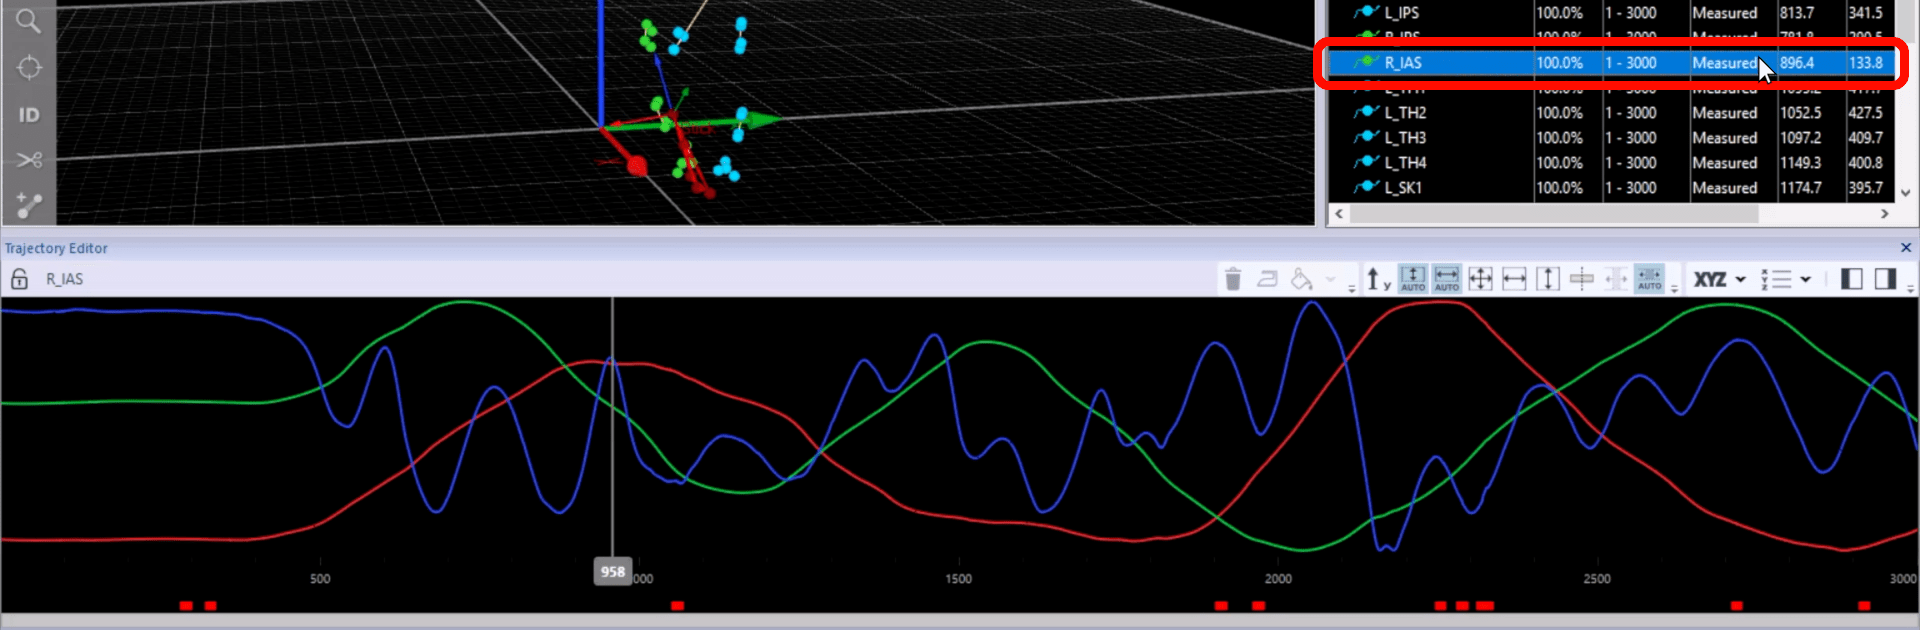
Open the editor (keyboard shortcut Ctrl+T), and click on a trajectory in the 3D viewer or the trajectory info pane to edit it.
-
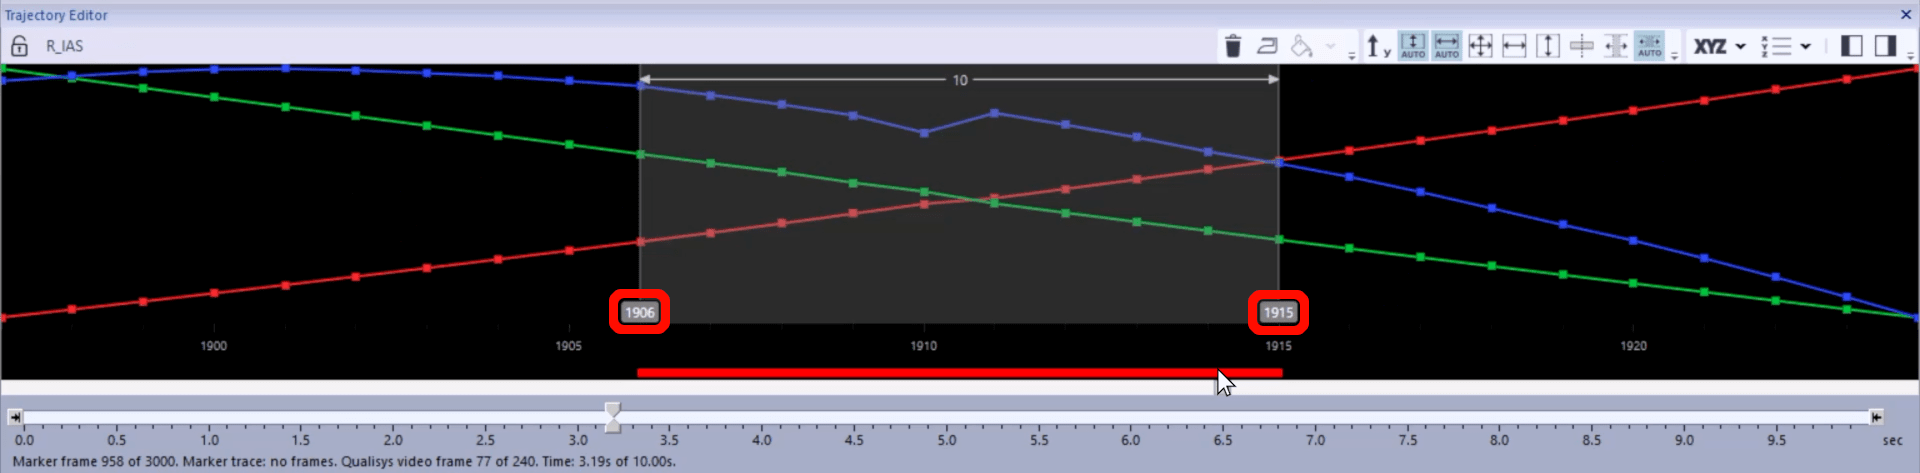
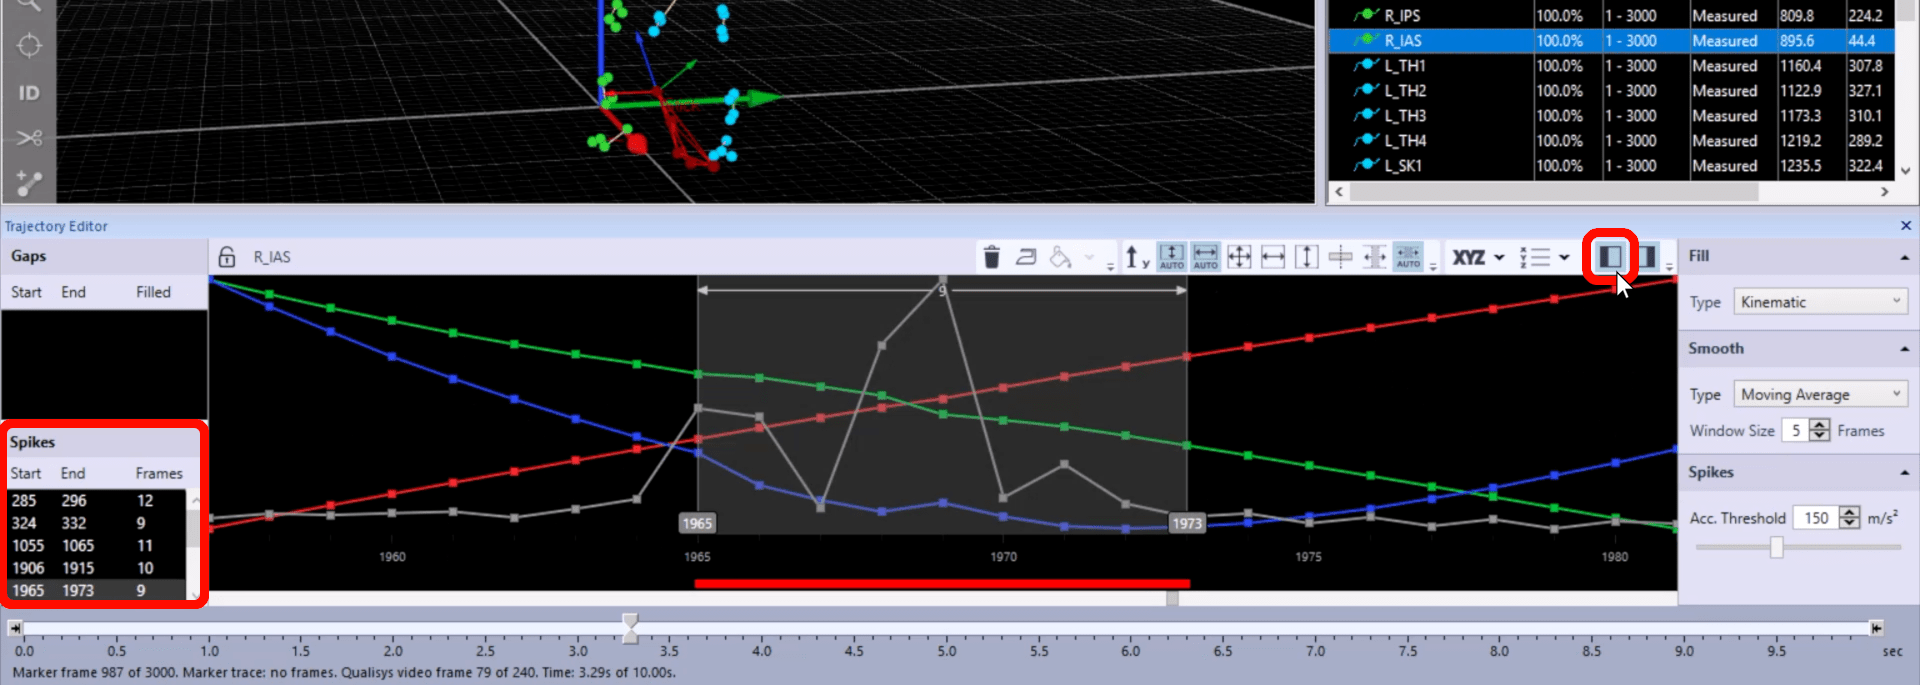
In the plot area of the trajectory editor, spikes are indicated with a red bar. Clicking on a spike will highlight it and display the frame numbers for the range that also includes four frames on either side of the spike.
-
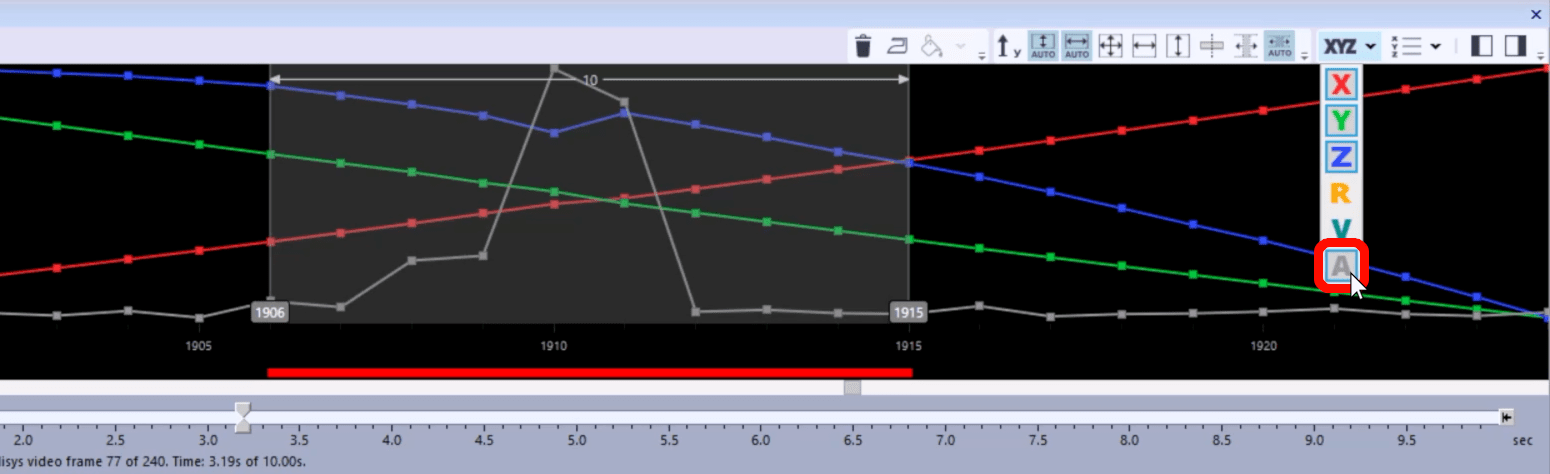
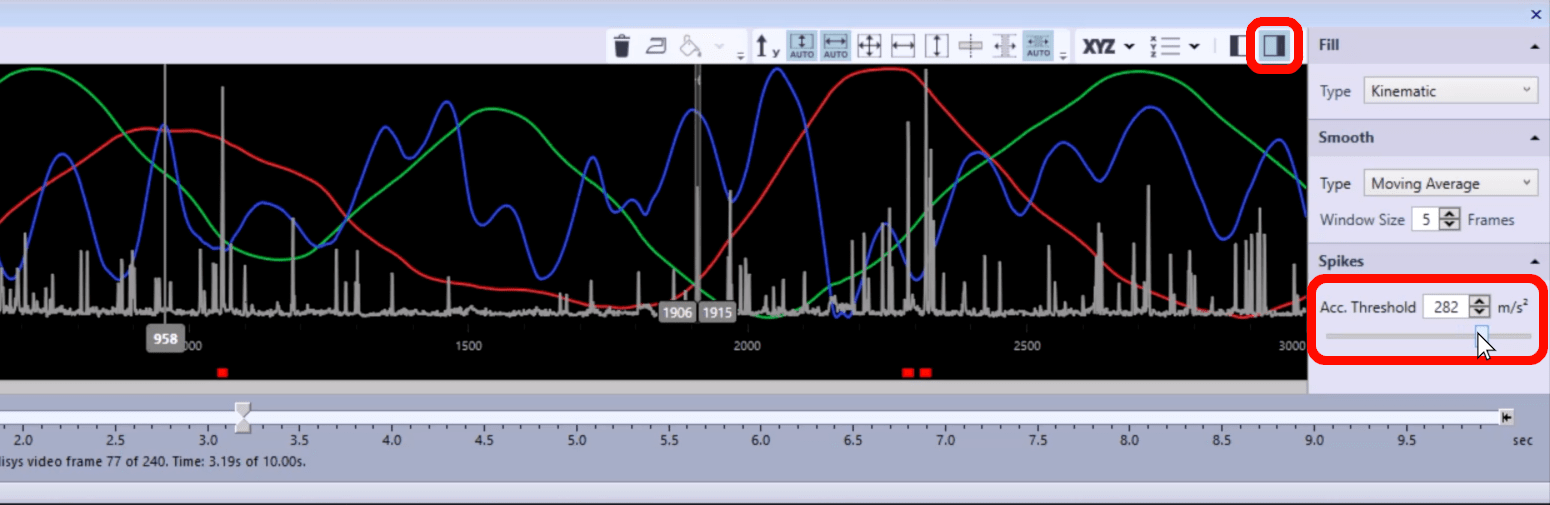
You can visualize the spikes more easily by clicking the “Series” icon and selecting the acceleration graph.
-
If you open the Settings sidebar, you can adjust the acceleration threshold to control the sensitivity of spike detection.
-
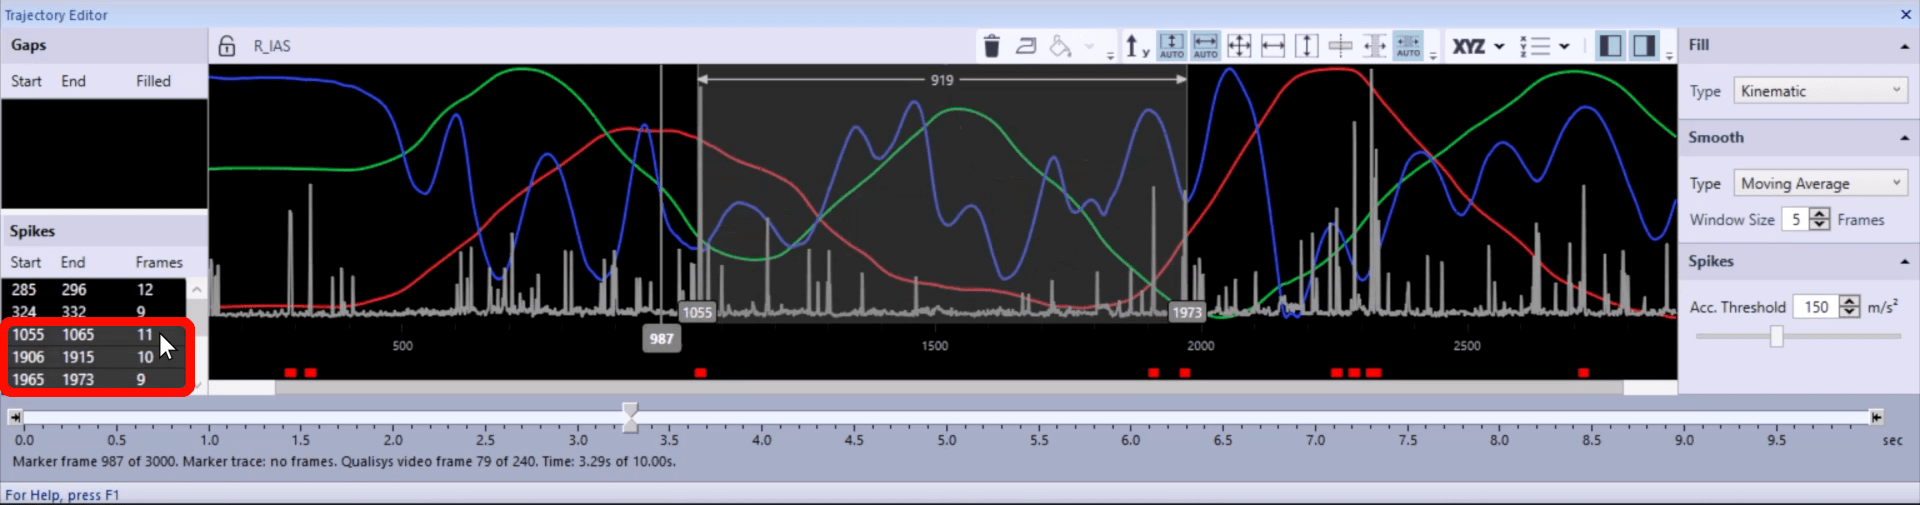
To easily locate all spikes, open the Points of Interest sidebar, which will list the spikes detected in the trajectory. When you click on one of the spikes listed in the sidebar, the trajectory editor will select it. If the “Zoom to Point of Interest” feature is activated (keyboard shortcut G), the trajectory editor will also zoom in on the spike when you click on it.
-
You can select multiple spikes from the list by holding down the Shift key, and the trajectory editor will display the range that includes all of them.