Viewing trajectories
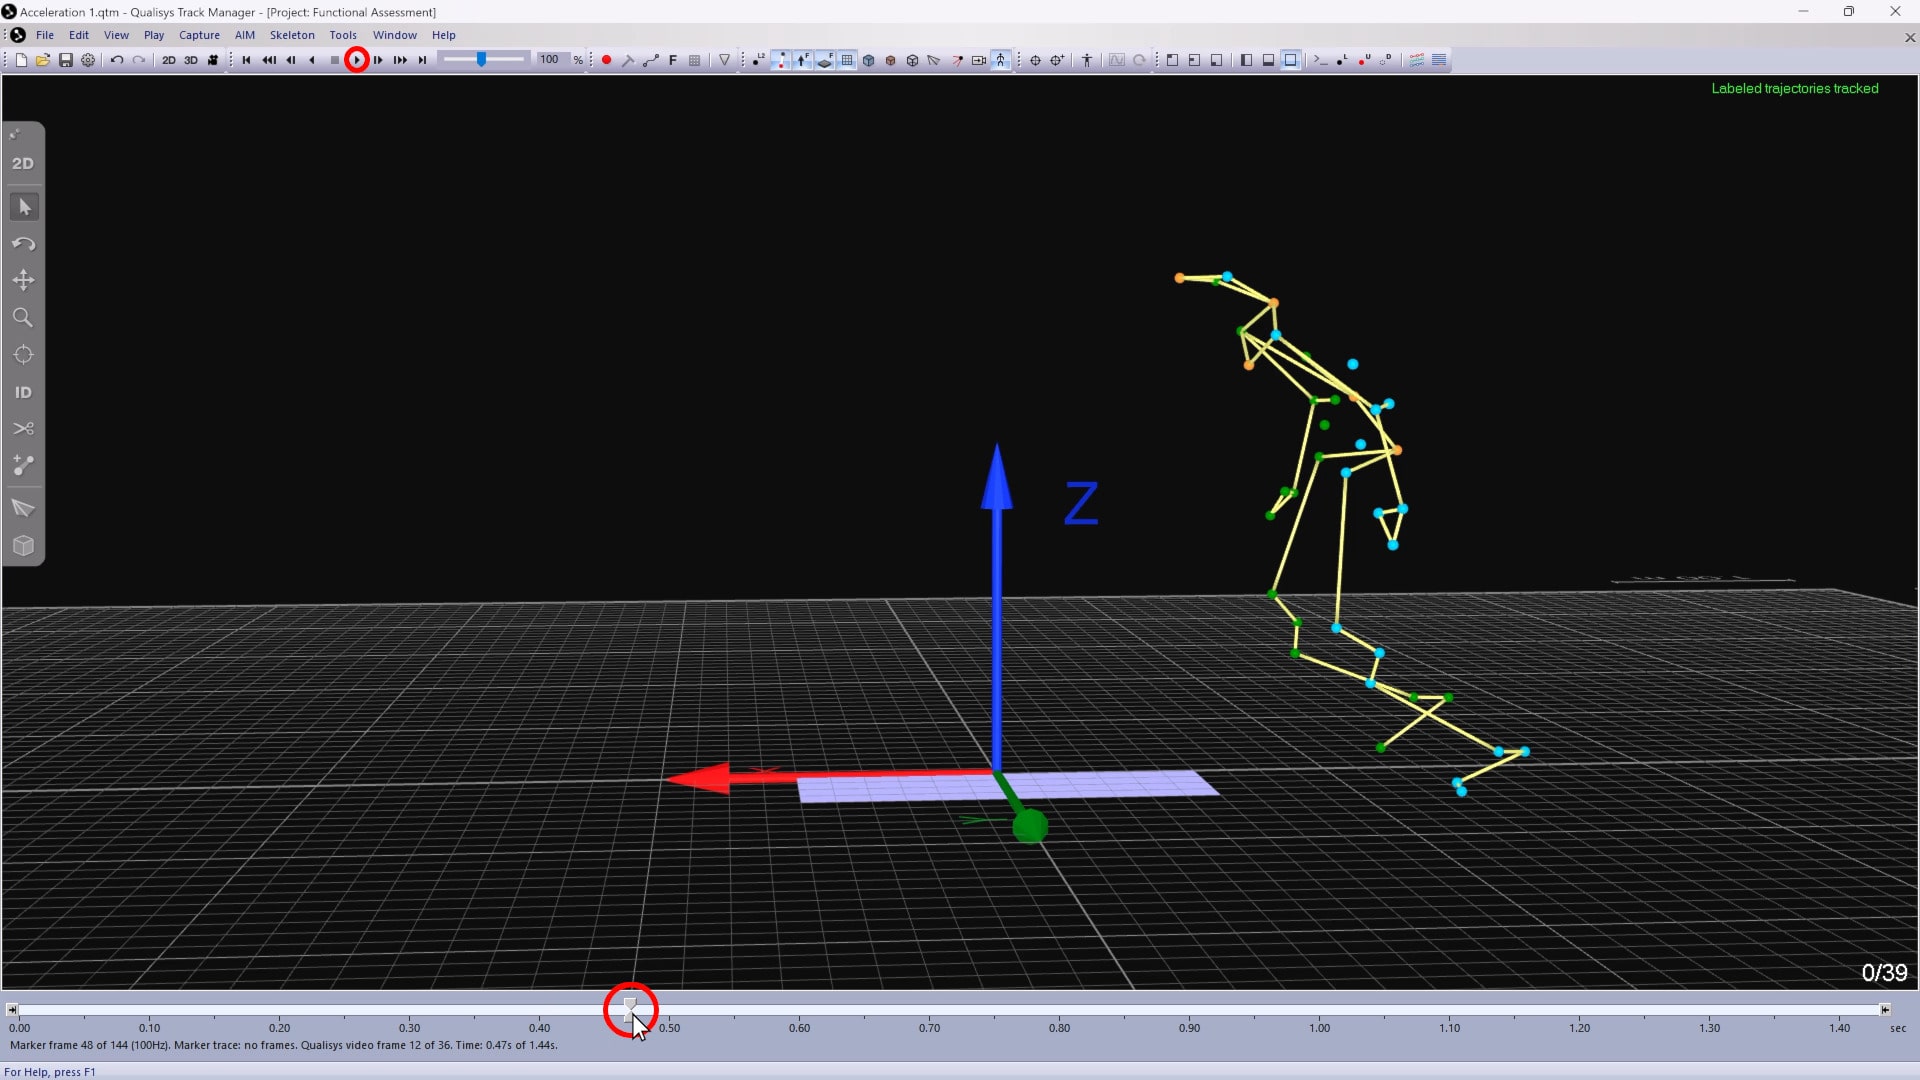
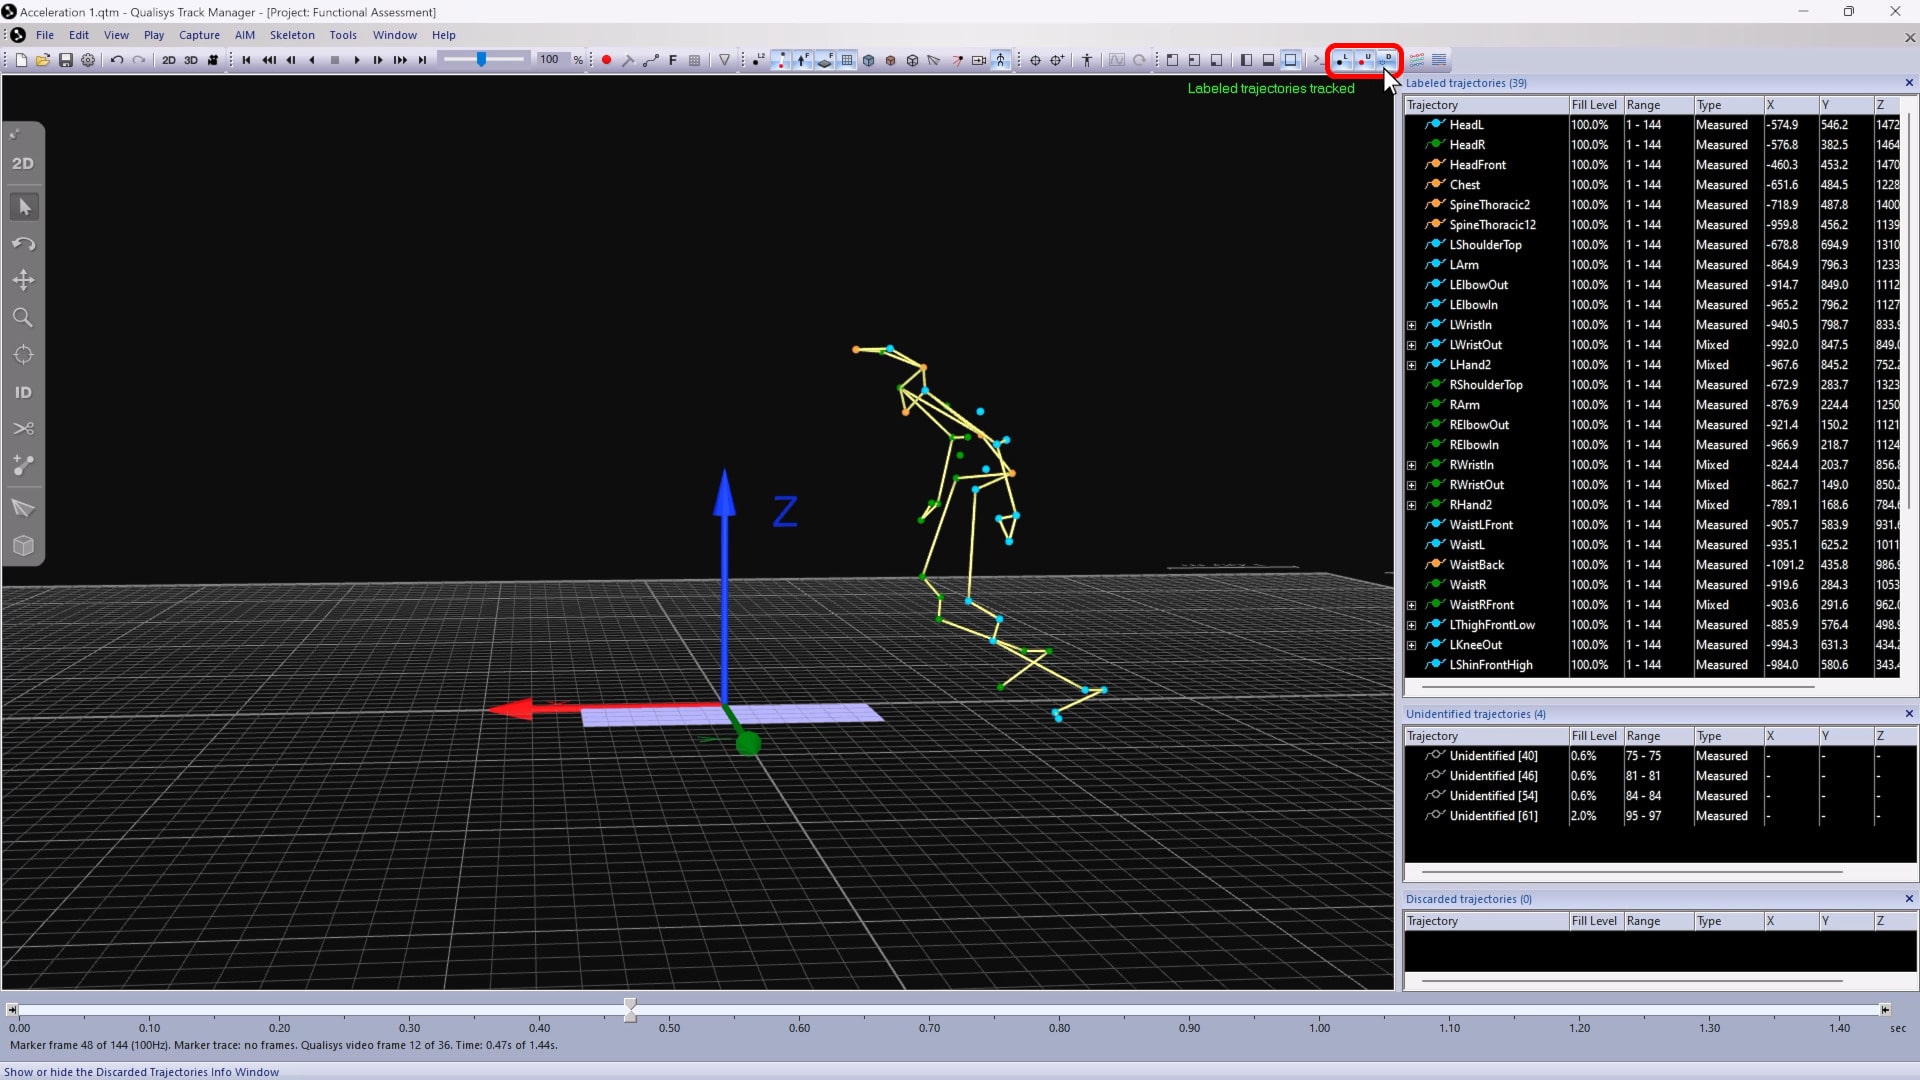
When a file is open in the 3D viewer, you will see markers indicating the position of each trajectory at the current frame. You can review the motion of the trajectories throughout the measurement by moving through the timeline slider or clicking the play button.
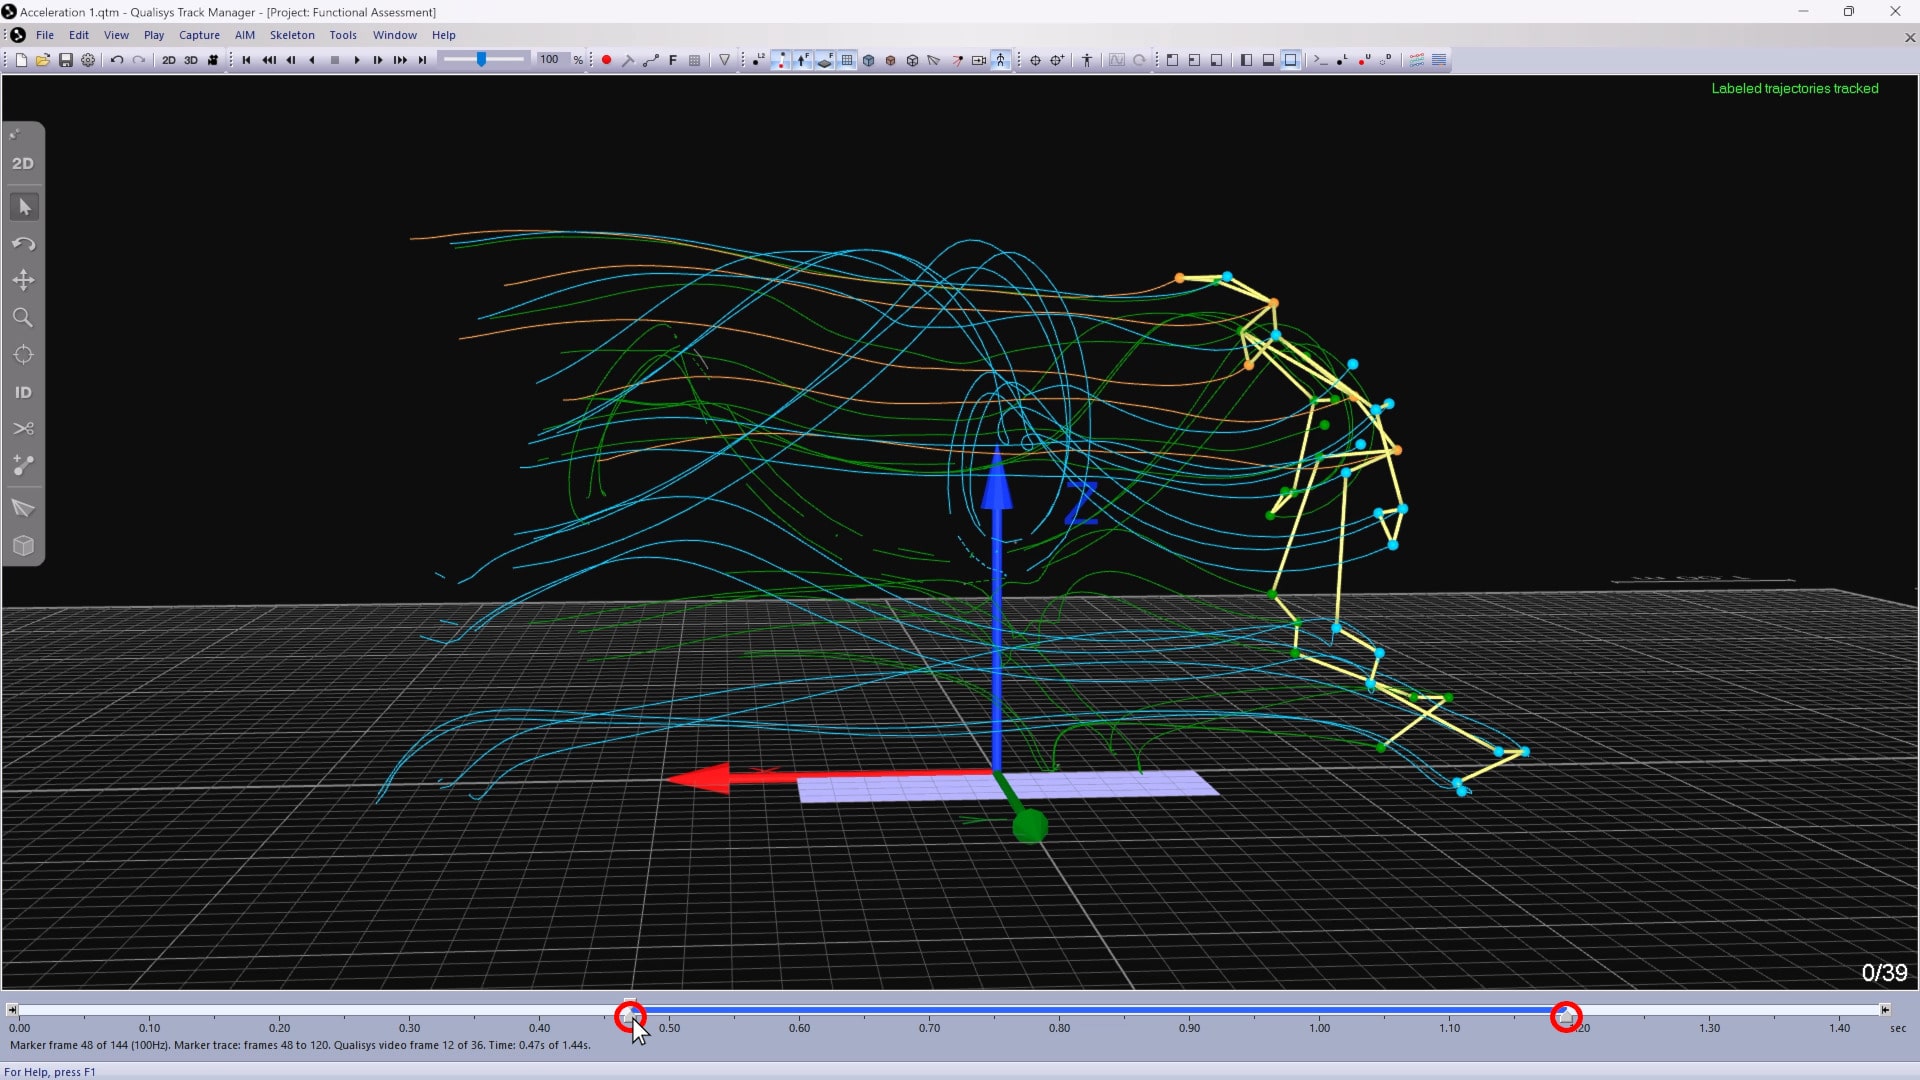
To view the traces of the trajectories over time, expand the bottom triangles on the timeline slider.
You can choose how trajectories are displayed by default in the 3D viewer:
-
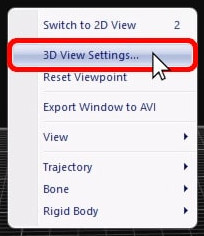
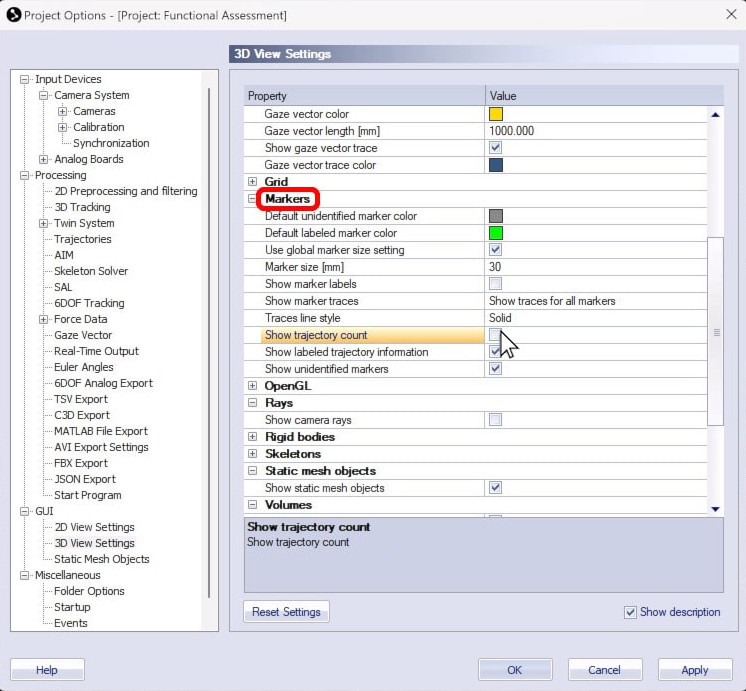
Right-click on a blank area of the viewer, and select “3D View Settings.”
-
In the settings window below “Markers,” you can set the colors and sizes of the display markers, customize the traces, and select which trajectory information to show in the viewer.
-
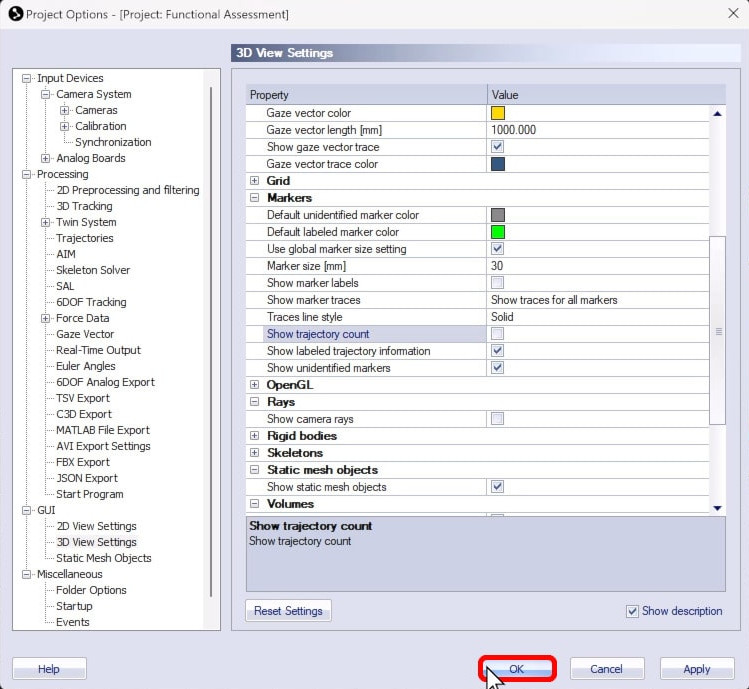
Click “OK” to save your changes.
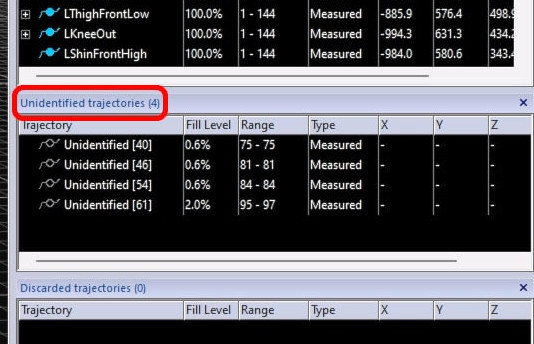
The trajectories are automatically categorized and listed in trajectory info windows, which can be toggled from the top toolbar.
-
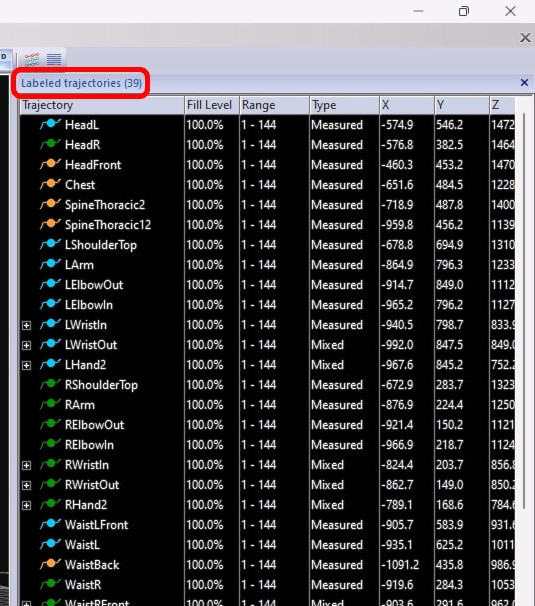
The “Labeled” pane lists the trajectories that have already been identified, whether manually or through an AIM model.
-
The “Unidentified” pane shows trajectories that are not yet associated with labels.
-
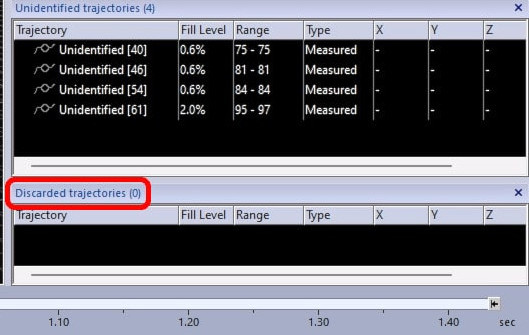
The “Discarded” pane shows any trajectories that have been deleted.
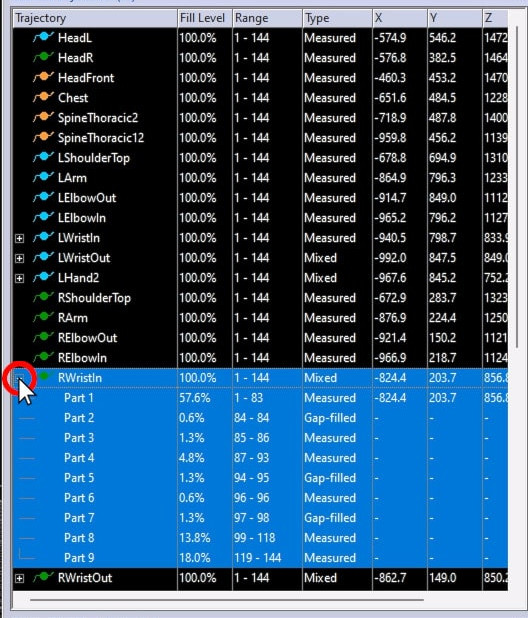
The trajectory info windows contain information about each trajectory:
-
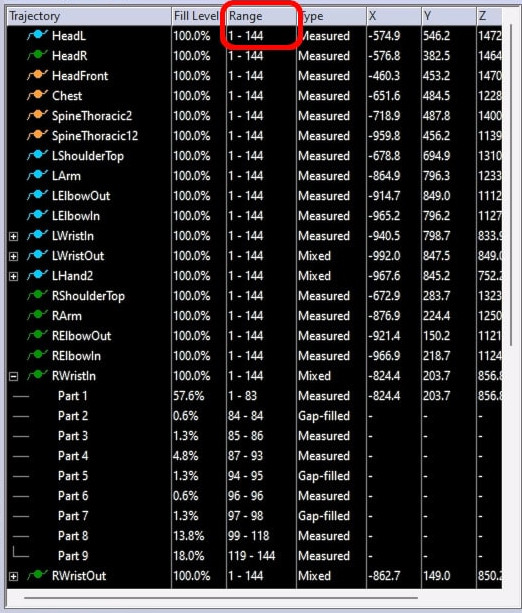
A plus sign means that the trajectory consists of multiple parts, which are listed when you click on the symbol.
-
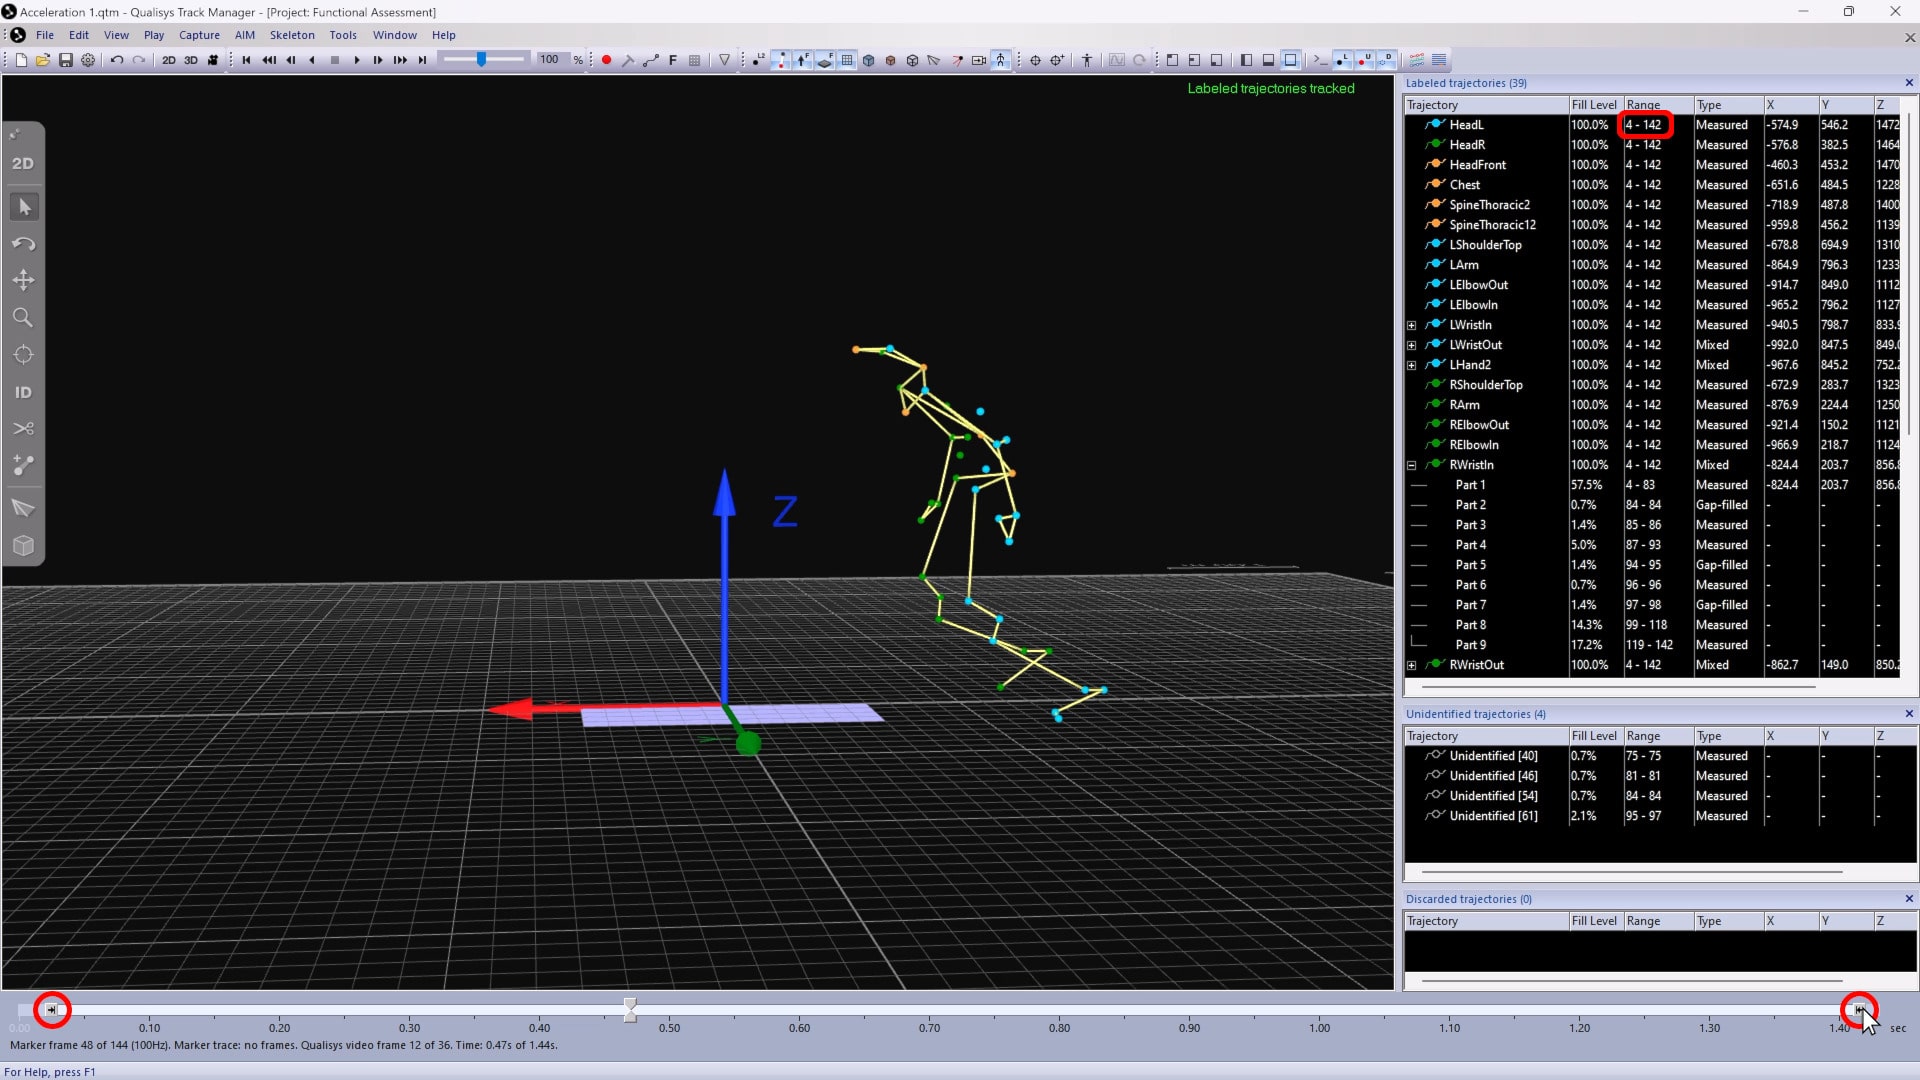
The Range column shows the frames associated with a trajectory or part.
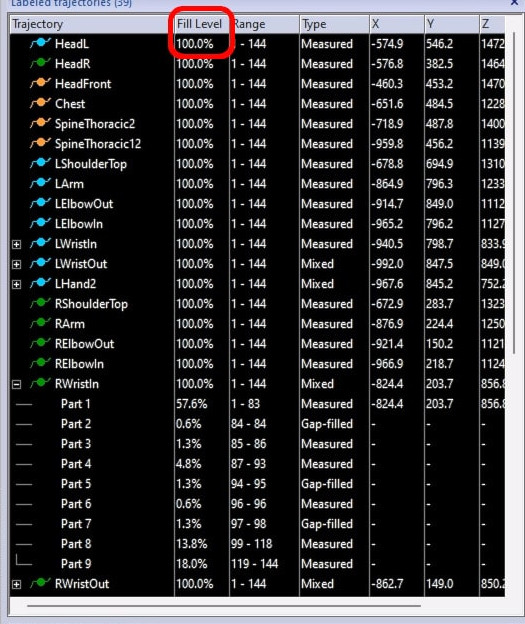
-
The Fill Level column shows the percentage of that range in which the trajectory is tracked.
-
You can adjust the range by sliding the arrows on each side of the timeline bar—for example, narrowing the data to a section in which all of the trajectories are at 100% fill level.
-
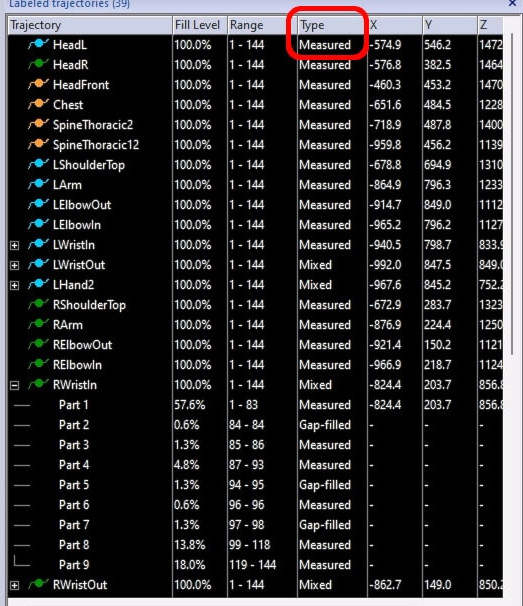
The type of trajectory is also shown in the info pane. “Measured” means that it has been tracked from the measurement data, “Gap-filled” or “Edited” means that the trajectory has been modified, and “Mixed” indicates that the trajectory is made up of parts that are of different types.
-
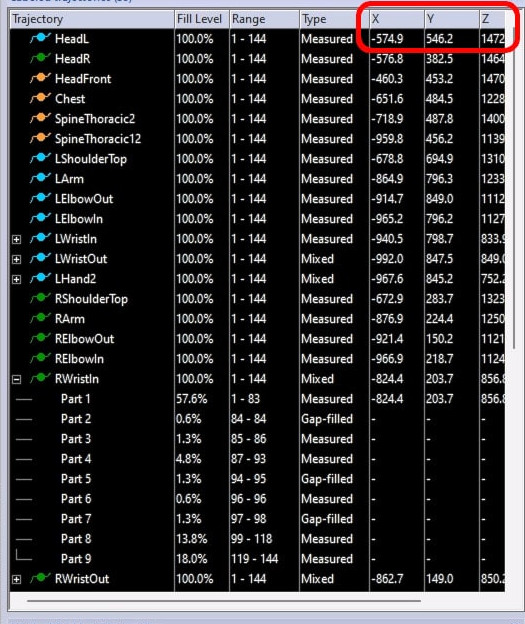
The X, Y, and Z coordinates indicate the position of the trajectory in the current frame.
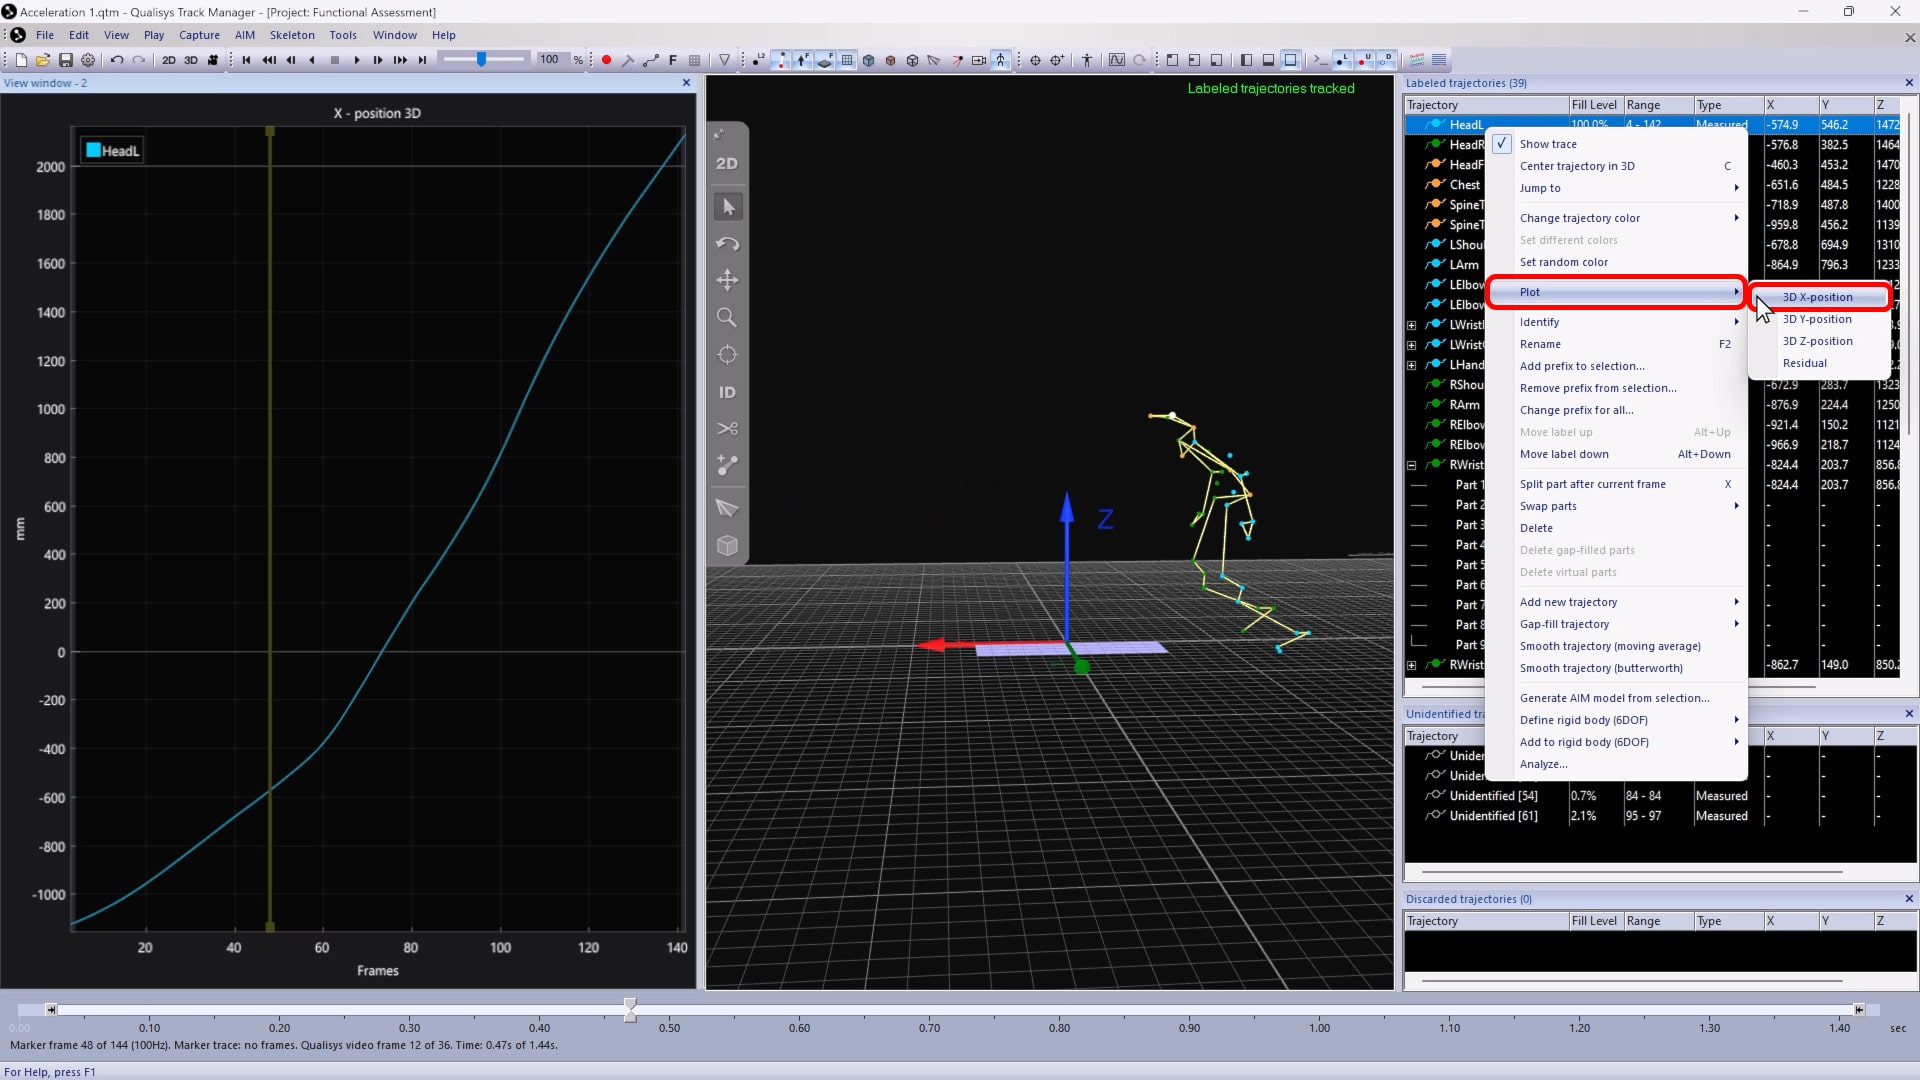
Any of the curves can be plotted by right-clicking on a trajectory, selecting “Plot,” and choosing a coordinate.