Visual3D report is available for 'Running' session only.
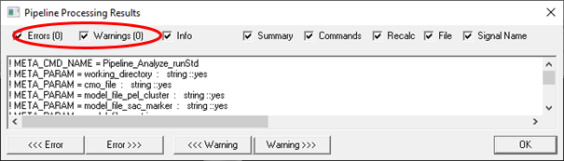
Run Analysis only. QTM automatically exports any file that has its checkbox checked and processes it with Visual3D. The pipeline should be completed automatically and with no errors or warnings. (It is possible that there are warnings if, for a particular measurement, it was not possible to compute all variables. Usually this is caused by mislabelled markers or gaps/occlusions. The analysis should be repeated after fixing the problem).
Upon clicking on “Analysis only” all checked motion trial of active session will be used to create report of active session. The result is a Visual3D report that can be printed or exported to PDF.
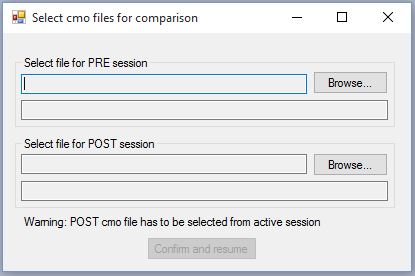
In order to create comparison report, “Single session report” must exist for both sessions. Click on arrow next to Analyze button under the running trials, then click “Compare sessions” button. Dialogue will appear to locate pre and post cmz files. It is assumed that session where you start the comparison analysis is post session.
Note that the comparison report does not recalculate the data. It only combines two sessions into one report. It is assumed that both single-session reports contain valid data that can be compared. Any changes to data should be made in the single session first.
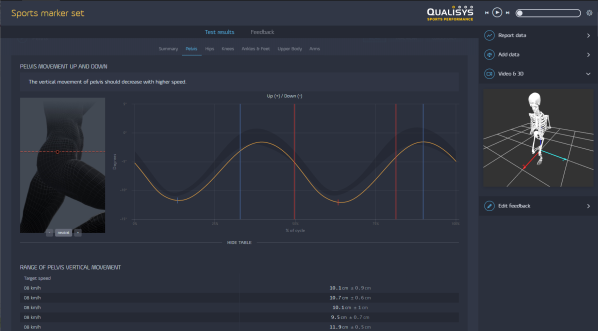
The report includes a simple postural analysis based on data from static trial. When capturing static trial it is important that runner stands still in upright position facing forward and both feet aligned in AP direction.
Postural analysis includes two screenshots of actual runner.
To remove postural analysis from report, please edit Templates/settings.php and change the line "'include_posture' => true," to "'include_posture' => false,".
Note: vertical line is always set to zero. For side view also ankle is placed to zero, for front view zero is in the middle of distance of ankles and coordinates of other joint are shifted accordingly.
Scoring of motion variability can be evaluated using MAP. Scoring is based on Baker, R. et al.: The Gait Profile Score and Movement Analysis Profile. Gait & Posture 30 (2009) 265-269. You can either choose to evaluate simplified MAP which does not include IQR+ for each trial or full MAP including IQR+ for each trial. By default, MAP calculation is off. To select reduced MAP edit Templates/settings.php and change the line "'map' => 'off'," to "'map' => 'reduced',". To select full MAP, change the line to ‘full’.
Note that calculation of full MAP increases the processing time when performing the Analysis. To limit time required to do the calculations, you can modify $MAP_cycles_max. $MAP_cycles_max expresses how many running cycles are included in IQR+ calculations.
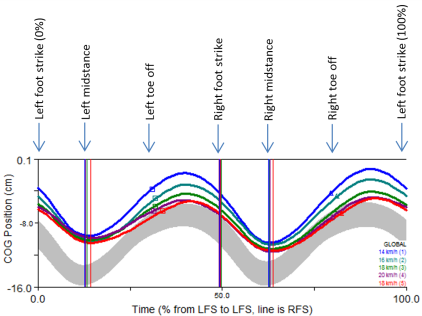
The following figure shows the meaning of the graph annotations (events) in the Visual3D report.
Comparison report is available only for 'Running' session.
Select “Compare sessions” analysis to compare two sessions:
Select the Visual3D file (*.cmz) from the pre- and post session.
Run Analysis and web report. QTM automatically exports any file that has its checkbox checked and processes it. After processing, the report is automatically uploaded to Report Center.
Note: this process may take up to 1-2 minutes, depending on the speed of the computer, the number of trials and the speed of the internet connection.
Shows an interactive and elaborated html report in your default web browser (we recommend Google Chrome).
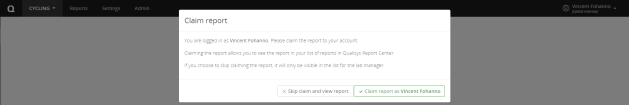
Each time a report is generated you will have the choice to "skip claiming and view report" or "claim report as". The latter option ("Claim report as") is recommended as it will connect the report to your personal Report Center on Qualisys.com. Use your Qualisys.com credentials to log in when you are claiming the report.
Once done, you will be able to view the html report in your web browser.
Note: If the same report for a given session is uploaded multiple time, previous versions are hidden and only the latest one will be available in your Report Center. If you would like to generate a new report instead of overwriting the previous report, go to QTM > PAF pane, right-click your session and select "Edit details", then uncheck 'Update existing web report' checkbox.
Reports are stored online and previously created reports are accessible via Report Center (https://report.qualisys.com). For details on how to use Report Center please see separate online documentation.
It can sometimes be useful to include files generated by other software in a report. To do this, you can use attachments.
If you would like to store web report locally as a single HTML file, choose this analysis type.
You can modify report if needed (e.g. check and correct events).
Note: Any time you click “Analysis only” button, the report is recreated. To keep changes, report can be opened by double click on cmz file name at Project data tree. This way cmz file will be opened without reprocessing.

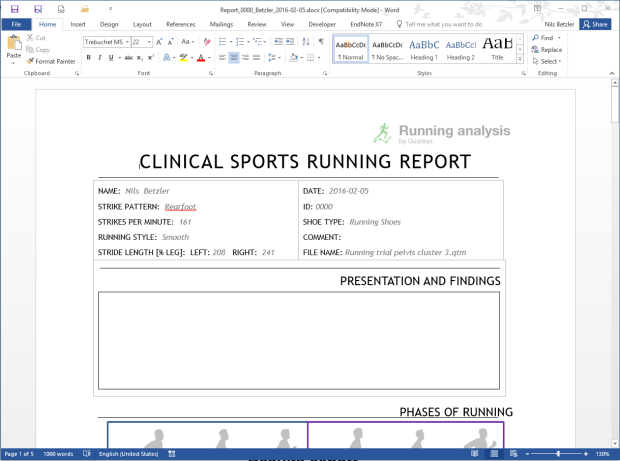
Word report is available only for 'Running - Clusters' session. It shows bar charts and automatic text output based on the test results. The last page shows the reference values and test data that is used to generate the Word report.