Plot menu
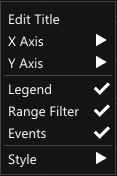
The Plot menu contains the settings and layout options of the plot. It can be accessed by right-clicking anywhere in the Plot window.
The following options are available:
-
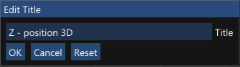
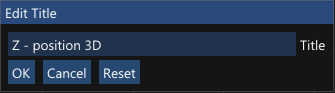
Edit Title
Open a dialog for modifying the plot title. Use the Reset button to revert to the initial title of the plot. -
-
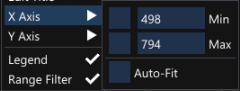
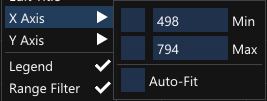
X Axis / Y Axis
View or modify the respective axis settings. Edit Min or Max to set custom plot limits. Tick the check boxes for Min or Max to use fixed values for the plot limits, or Auto-Fit for automatically adapting to the data range. -
-
Legend
Show or hide the legend. -
Range Filter
Enable or disable the range filter. When the Range Filter is enabled, only data within the selected measurement range is shown. When disabled, all data within the measurement range is shown, and data outside of the selected range is shown in the gray area. -
Events
Show or hide events. -
Style
Choose between dark or light mode.
When using Window layouts, Plot menu settings are stored as part of the Windows layout.