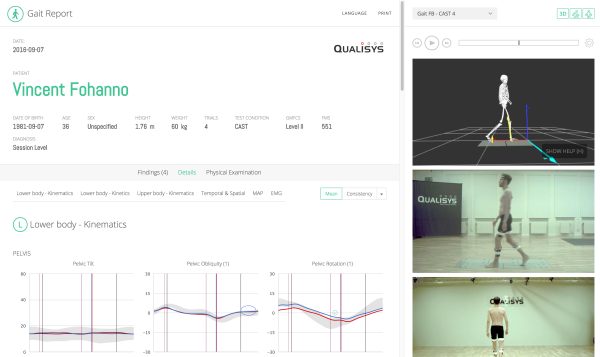
The web report is an interactive report displaying analysis results, a 3D viewer with "skeleton" and video players.
Before generating a web report, the data must be processed with Visual3D, using the Visual3D Analysis option in the Start processing dropdown menu (QTM > Project view).
Two types of web report are available.
If you select Offline web report, the report will be stored locally on your computer and cannot be accessed by any external person, unless you share it by passing the .html file on to someone.
If you select Online web report, the data is uploaded to a secure cloud storage location. Use your qualisys.com credentials to log in to the Report Center to retrieve, edit or share reports (https://report.qualisys.com).
The report is separated into two panes: the main pane (left) displays Details and Findings. The interactive pane (right) contains 3D viewer, video players and the Edit impairments section.
Video and 3D viewer playback is controlled by the playback controls:
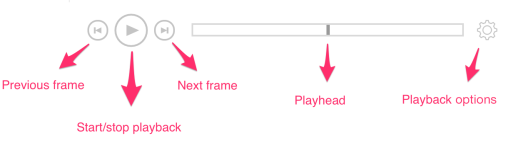
To move forward or backward within the file, click and move the playhead while holding the mouse button. You can also step forward or backward one frame at a time with the previous/next frame buttons or by using the left (←) and right (→) shortcut keys.
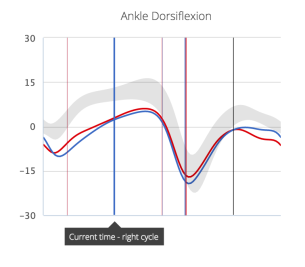
The current time is indicated by the timeline playhead and by thin grey vertical lines in timeseries charts. These lines, or playheads, represent the current time relative to individual gait cycles. There is one playhead for the left cycles and one for the right. Note that two playheads are needed since the left and right gait cycles have a temporal offset.
In consistency mode, the current cycle gets highlighted as the video and 3D viewer playback updates.
Note: In offline web report current cycle will be highlighted in kinetics graphs only if number of kinetics cycles match the number of kinematics cycles.
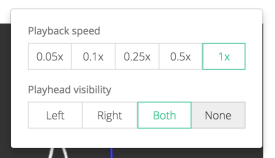
You can set the visibility of the chart playheads individually via the playback options(shown below). You can also change the playback speed.
The 3D viewer and video players can be hidden by toggling the corresponding buttons:
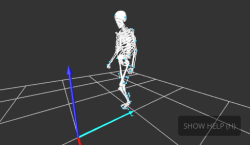
The 3D viewer shows the markers belonging to the model and the body segments (skeleton).
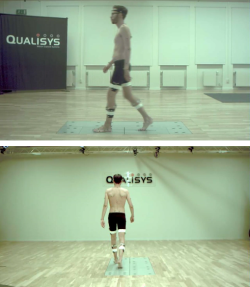
The report can show up to two videos per measurement. Typically you want one sagittal and one frontal camera. Note that the correct suffix for the recorded video files must be specified prior to report generation, see “Video setup”. The video included in the report are compressed versions of the original captures. The compression takes place when generating the report.
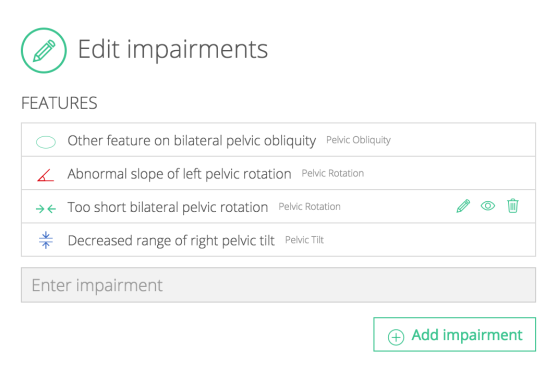
In the Edit impairments section of the interactive pane, you can add and edit impairments. See “Workflow for adding features and impairments” for more details.
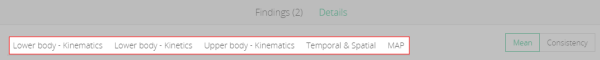
The details pane shows charts for the kinematic and kinetic parameters, tempo-spatial parameters, the Movement Analysis Profile (MAP) and EMG.
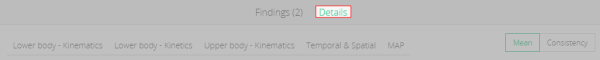
Then navigation bar can be used to quickly move from one group of parameters to another:
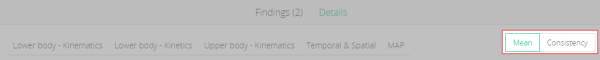
Use the mean/consistency buttons to set whether the charts show the mean of all trials or all individual curves (Consistency):
The tempo-spatial parameters can be displayed in simple view (numeric values only) or detailed (bar charts):
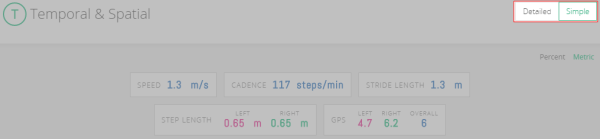
You can further display the simple view as metric values or percentages. Percentages are normalised to leg length and expressed as % of the normative values (see “Appendix B - Reference data” for how to set your own normatives).
Note that normative data in offline web report cannot be changed.
MAP is based on Baker, R., McGinley, J. L., Schwartz, M. H., Beynon, S., Rozumalski, A., Graham, H. K., & Tirosh, O. (2009). The Gait Profile Score and Movement Analysis Profile. Gait & Posture, 30(3), 265–269. This paper introduces the GPS as a comprehensive metric summarizing overall gait deviations by calculating the root mean square (RMS) differences between a subject's kinematic data and normative data across the gait cycle. The GPS is derived from nine key kinematic variables, each represented by a Gait Variable Score (GVS). These GVSs are visualized collectively in the Movement Analysis Profile (MAP), providing clinicians with a detailed breakdown of gait deviations across different joints and planes. IQR stands for interquartile range and describes the spread of GPS values and GVS values within their sample population.
The web report can include EMG data that can be displayed as processed EMG (mean, consistency) or raw EMG.
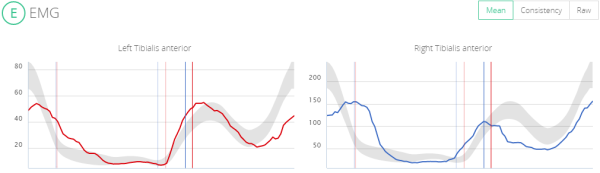
First, make sure that your EMG channels adheres to the EMG naming conventions.
Then, all EMG channels defined in QTM will be plotted in the EMG section of the report (Details tab).
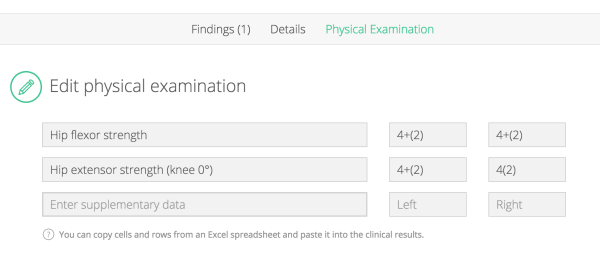
You can insert physical examination data in the Physical Examination tab. Once a physical examination has been entered, you can reference individual examination fields when you define impairments. For more information on how to associate physical examination fields with impairments, see “Impairments”.
To add physical examination data simply type in the information using the input fields. Each row corresponds to a parameter with one or two values. As you type, new rows are automatically added.
Note that instead of typing manually, you can also copy and paste a table directly from Microsoft Excel. Please note that when pasting from Excel, only the first three columns will be inserted.
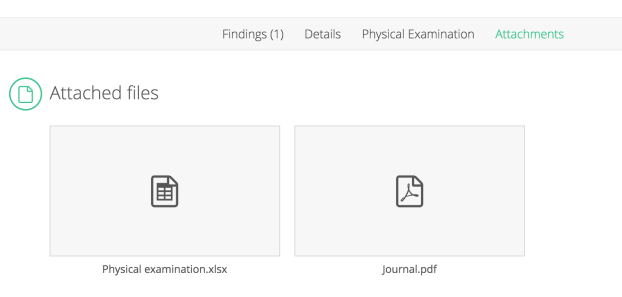
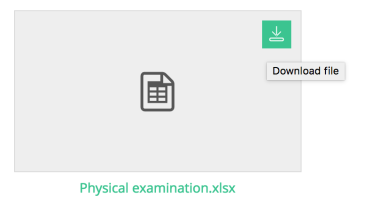
It can sometimes be useful to include files generated by other software in a report. To do this, you can use attachments.
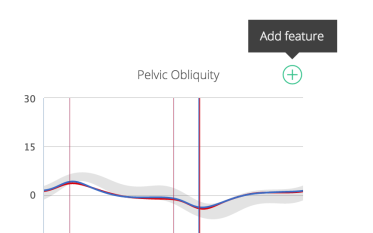
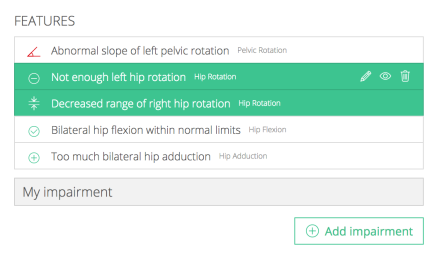
Gait features are used to annotate charts with relevant information. You can add features with or without symbols. Symbols should be used when you want to annotate a specific part of a chart while a chart-wide feature is used to make a note associated with the entire chart.
Note that you cannot create impairments without first creating at least one feature.
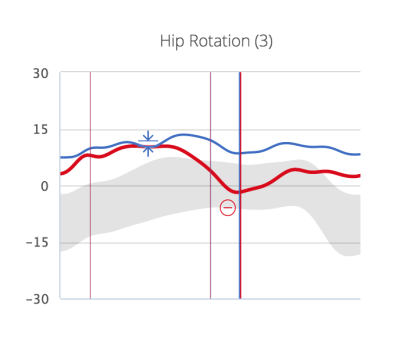
The number in brackets in the chart title indicates the number of features that have already been added to a chart. See “Workflow for adding features and impairments” for details.
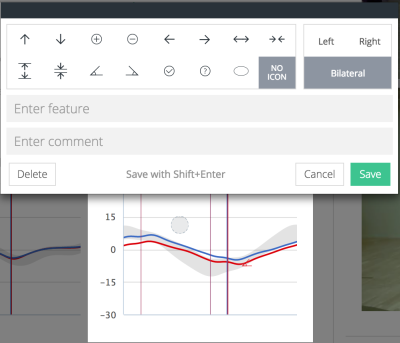
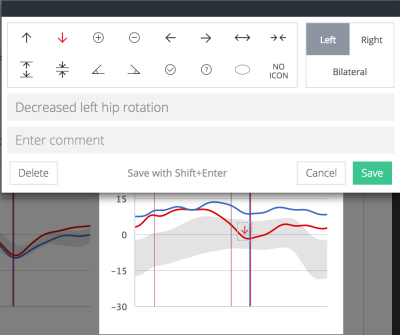
To edit a feature either double-click a symbol in a chart or click on the edit icon ![]() in the features list.
in the features list.
Tip: to scroll to the chart that contains a feature, click on the eye icon![]() .
.
You can reorder features in the feature list of the Edit impairments section.
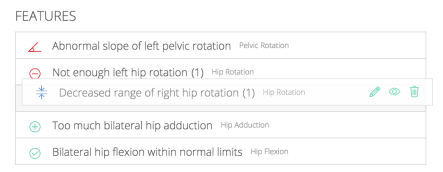
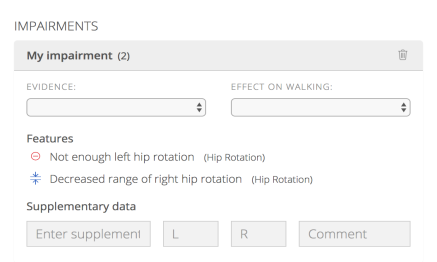
Gait features can be associated with one or more impairments. In addition to features, an impairment can also be associated with supplementary data.
To add supplementary data or set the Evidence and Effect on walking levels, see “Editing impairments”.
In the impairments list of the Edit impairments section:
In the impairments list of the Edit impairments section:
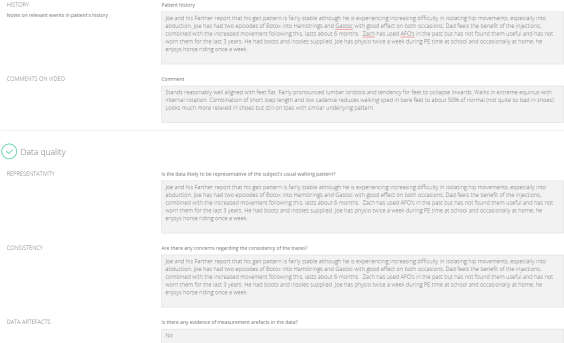
The findings tab is intended for users of the report that require an overview of the findings after the analysis has taken place and been processed. The structure is based on a template prepared by Baker, McGinley and Thomason for the workshop 'Impairment focused interpretation' at the JEGM meeting, Miami, 2010. Some adaptations have been made based on other example reports (Baker, 2013). The following sections are included:
Mark-up: this is the process of identifying features in the gait charts.
Reporting: documentation of the interpretation process. The Findings pane includes text boxes to add additional information for the referrer.
Entries to these text boxes are automatically saved locally inside the web browser. This means that they will be preserved on the local computer (e.g. when re-generating the report), but to share the comments with other users, the report much be printed using the Print feature.
More detailed information about impairment focused interpretation can be found in Baker (2013), chapter 12.
The colour of the curves in the charts can be changed by modifying the file Templates/settings.php with a text editor. The file includes a section with "General" report settings, including $line_color_left and $line_color_right. By default, red is used for the left body side and blue for the right body side.